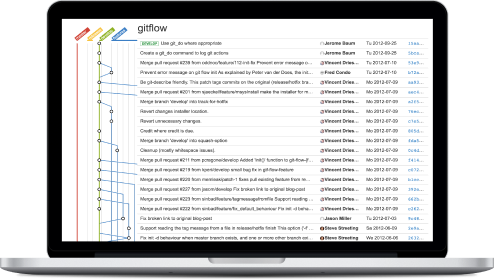
Visualize your Git Flow Commits
Bring your commits to life by using the Git Flow Chart to visualise the relationship between branches.
Sign Up


Also available for: BitBucket Server and Bitbucket Cloud

Bring your commits to life by using the Git Flow Chart to visualise the relationship between branches.
Sign UpAlso available for: BitBucket Server and Bitbucket Cloud
Want to know which commits are part of your branch? By clicking on a specific commit, the Git Flow Chart highlights the entire parentage tree, allowing you to identify exactly which parts of the tree are in your branch
Paste a public Github Repo URL and see how it works.
Analysing your code base can be a real challenge, especially in a Git Flow with unlimited feature branches, releases and hotfixes. The Git Flow Chart simplifies this task by visualising the relationship between commits
Per user per month.
Starting at € 25 / month
Copyright © 2014-2015 Collabsoft, all rights reserved.